Healthwatch Trafford Autumn/Winter survey 2023

The aim of this project was to investigate a change over a 12-month period of Trafford residents’ experiences using general health and social care services and to find out whether findings from our previous report have had a positive impact on such experiences. We would then compare the findings to our Autumn/Winter report from 2022 (available here), to assess change.
What did we do?
We launched the survey in October 2023 which remained live until January 2024. It was sent to our Healthwatch 100 subscriber list and promoted on our website and social media pages. We also visited local groups, events and attended meetings with local partners during this time where we shared the survey.
Key findings
The five services we heard most about in the survey were:
- GP services
- Pharmacies
- Mental health services
- Hospital outpatients' appointments
- Dentists
This was similar to responses from the 2022 survey which had a high rate of feedback regarding GP services, hospital services and dentists.
Similar to 2022 - and following a wider trend more generally for Healthwatch Trafford - GP services were the service most mentioned in the 2023 survey. Although dentistry was joint second in 2022, a much lower proportion of respondents mentioned this type of service in 2023. Notably, in the 2023 survey the proportion of respondents mentioning Mental Health Services increased by a significant amount; taking it from joint seventh most mentioned in 2022 to joint third in 2023.
As before, it is important to note that there were positive comments regarding the high quality of care received by a considerable proportion of respondents in relation to all services they told us about.
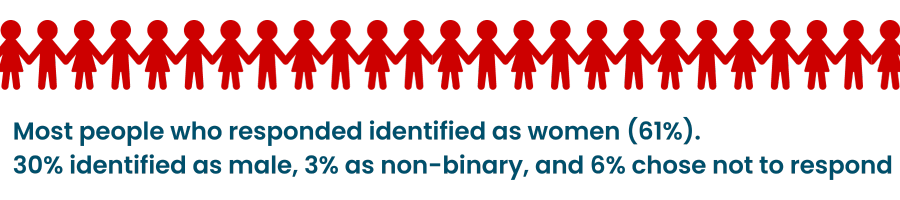
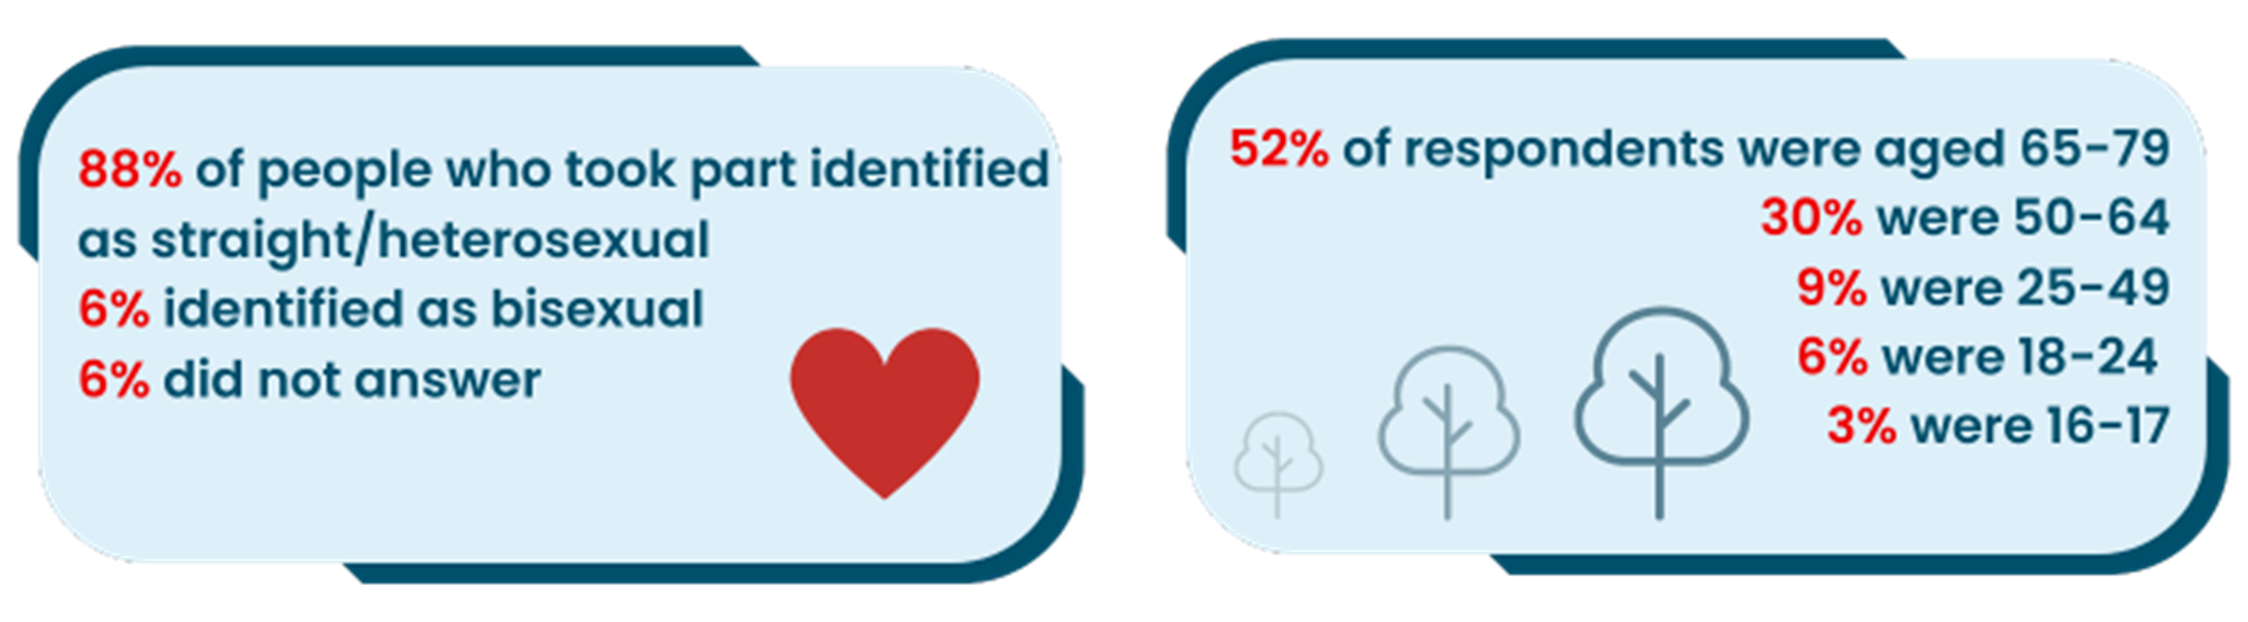
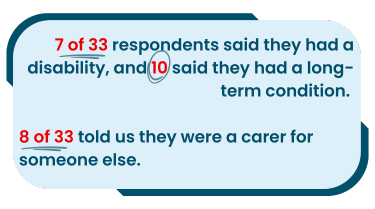
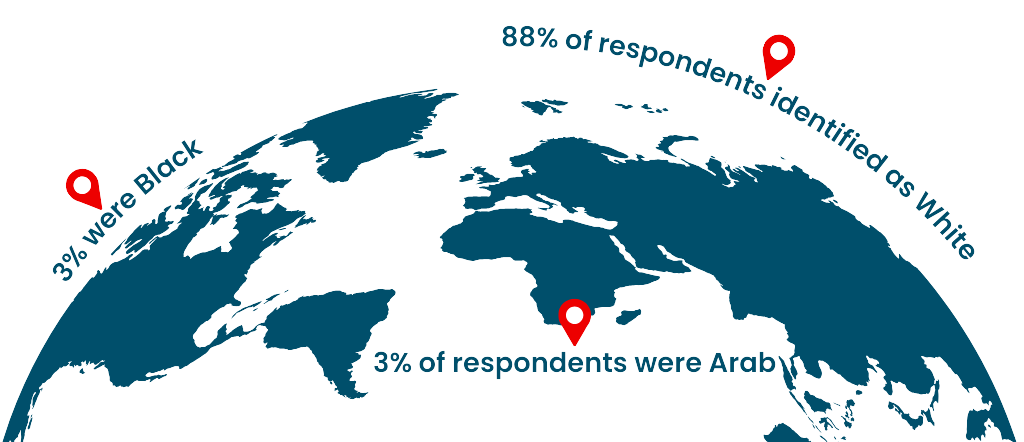
Who did we speak to?
When asked about finances: 55% of respondents had more than enough for necessities, and disposable income; 18% had just enough for basic necessities; 3% of people said they didn’t have enough for necessities and sometimes ran out of money; 3% did not provide an answer, and 21% did not know or preferred not to say.
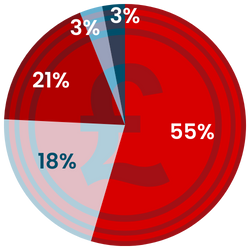
3% of people selected ‘other’ and 3% did not respond.
Overall themes
High quality care
Throughout the findings of this report, there is a clear trend in terms of patients’ high satisfaction with the care and service they receive. This is noticeable when hearing about their interactions with staff who are described as “friendly”, “superb”, “excellent” and “helpful”.
Waiting Times
Dissatisfaction with waiting times is a theme identifiable across the services discussed above. For example, this concern appears when recounting difficulties using AskmyGP and accessing face-to-face appointments, and with outpatient services this is evident at both referral and follow-up stages.
Communication
This relates quite closely to the concerns raised above. Communication in this context relates to systematic or process-based concerns, rather than interpersonal communication between staff and patients.
Considering the patient feedback around AskmyGP, the importance of face-to-face appointments, and the difficulty getting them, it may be that clearer communication about the use of AskmyGP and the benefits of different appointment types could help to improve relations. Similarly, more research could be done to explore instances where patients feel different appointment types are needed and why.
For outpatient services, communication concerns are raised through the need to either chase up the progress of a referral from the GP or the follow up of an outpatient service they received. In this case, clearer communication could ease the concerns of those waiting by ensuring they are kept up to date.
Closing comments
This report shares findings from the 2023 survey launched to find out about Trafford residents’ experiences using general health and social care services in the past 12-months and to compare findings to an equivalent survey conducted in 2022.
Although this project is a minimal snapshot of wider health and social care challenges across Trafford, its effectiveness is evident in that it has highlighted the three distinct themes outlined above – high quality care, waiting times and communication – which can then be used to inform improvement work across the borough.
Downloads
Download the full report below. If you require this in an alternative format, please get in touch.